 Modbus Tester
Free Modbus tester and simulator
Modbus Tester polls and writes registers as a Modbus master, and emulates a device as a Modbus slave, over TCP, UDP, RTU and ASCII. Build live HMI screens bound to your registers, publish values to MQTT, log to Excel and read the raw frames on the wire. Free for personal and commercial use, with no licence key.
Download version 3.3.0 Read the documentation
Windows 10, Windows 11 and Windows Server 2016 or newer, 64-bit. No sign-up, no licence key, no tag limits.
One tool for the whole job
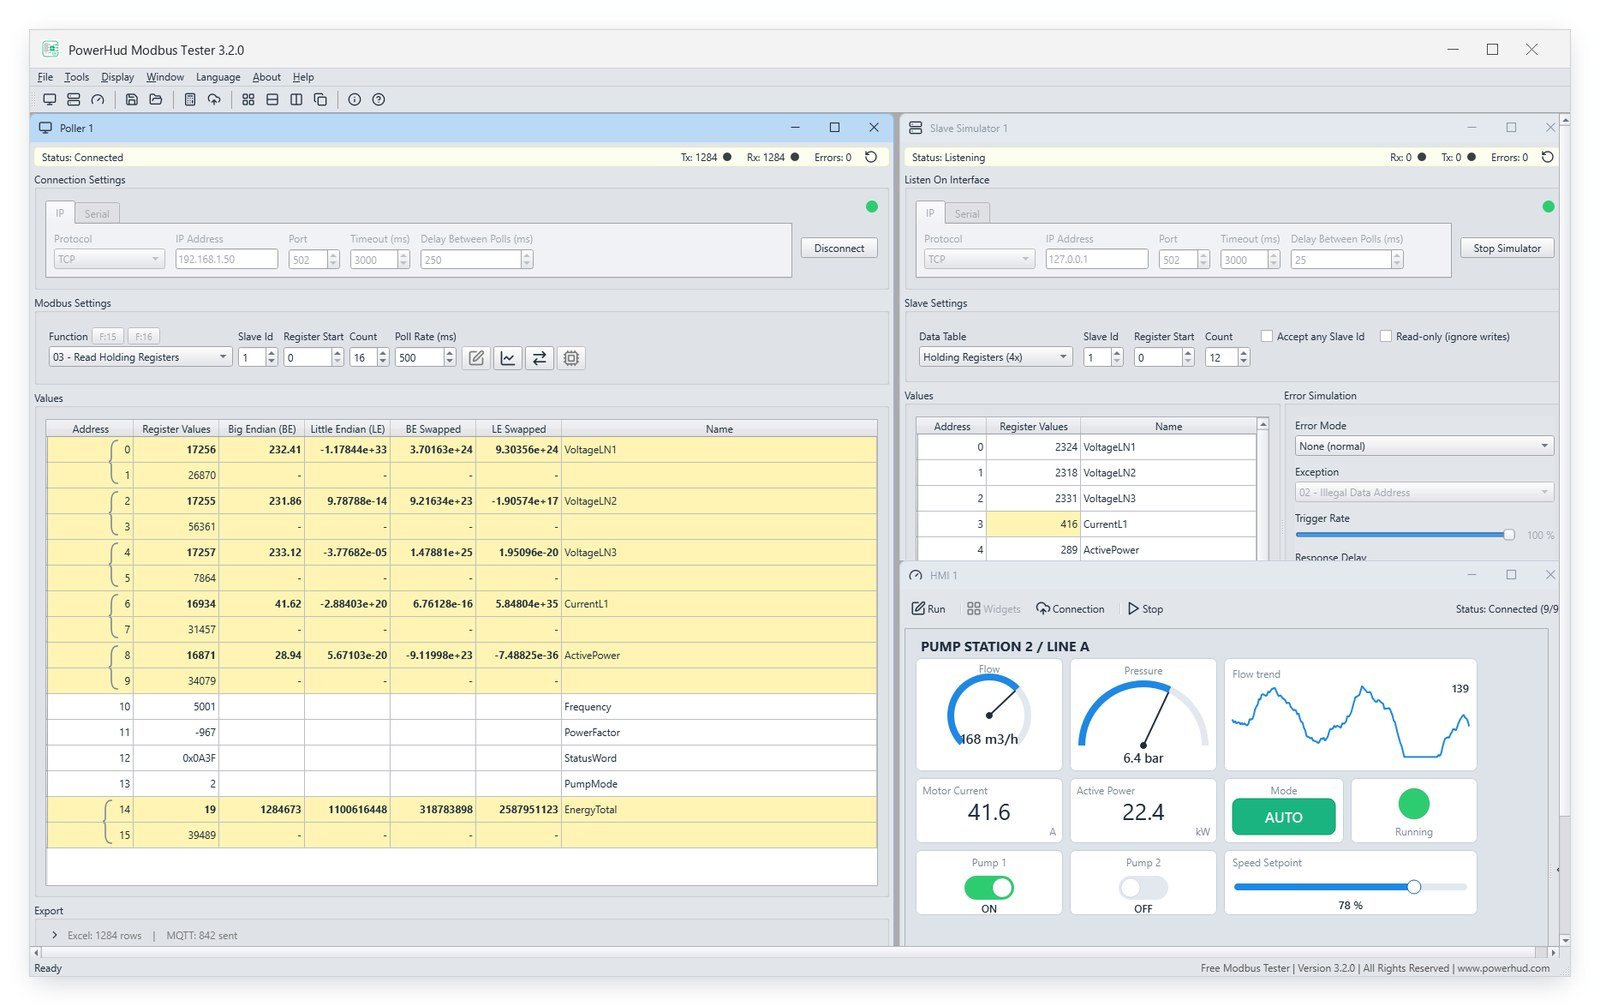
Modbus Tester is a free Modbus tool that replaces a shelf of small utilities. One piece of Modbus software covers every role you normally need while commissioning or debugging a Modbus network:
- Modbus TCP tester for devices on the network, over TCP or UDP.
- Modbus RTU tester for serial devices, in RTU or ASCII framing, over a COM port or tunnelled over TCP.
- Modbus poller that reads a register block on a schedule and writes back on demand.
- Modbus simulator that emulates a device so you can build and test a SCADA or HMI before the hardware exists.
- Modbus monitor that prints every request and response in hex for protocol level diagnostics.
- Modbus to MQTT gateway and Excel logger for the values you read.
- Modbus HMI screens with gauges, trends and switches bound to your registers.
A note on vocabulary: the current Modbus specification calls them client and server, while most tools, manuals and engineers still say master and slave. They mean the same thing. A poller window is the Modbus client, the simulator is the Modbus server, and this page uses the older names because that is what the devices in front of you are labelled with.
Modbus poller: use it as a Modbus TCP tester or Modbus RTU tester
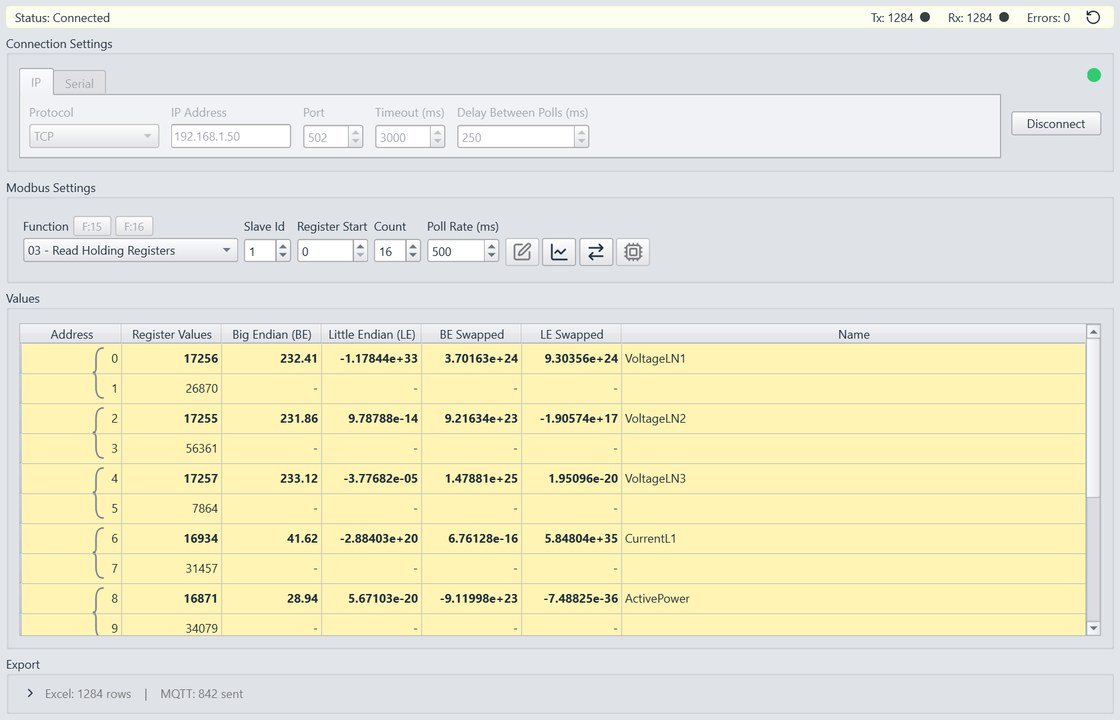
A poller acts as a Modbus master. It repeatedly reads a device, and writes to it on demand. Open as many poller windows as you need and arrange them from the Window menu, each with its own connection, and each reading a different device or a different register block.
- Reads: 01 Read Coils, 02 Read Discrete Inputs, 03 Read Holding Registers, 04 Read Input Registers.
- Writes: 05 Write Single Coil, 06 Write Single Register, 15 Write Multiple Coils, 16 Write Multiple Registers.
- Function, slave id, register start, count and poll rate can be changed while connected. The poll loop picks them up live.
- Writes run on the poll thread, so a write never races a read.
- Double-click a value to write that single register or coil, or use the write dialogs for signed, unsigned and hex values, with Set All and Clear All for coils.
- Read Device Identification (function 43 / 17) reports the vendor, product code and revision.
- Tx, Rx and error counters, with a Tx light on every request and an Rx light that blinks green on a good reply and red on a timeout.
Ten data types, four byte orders
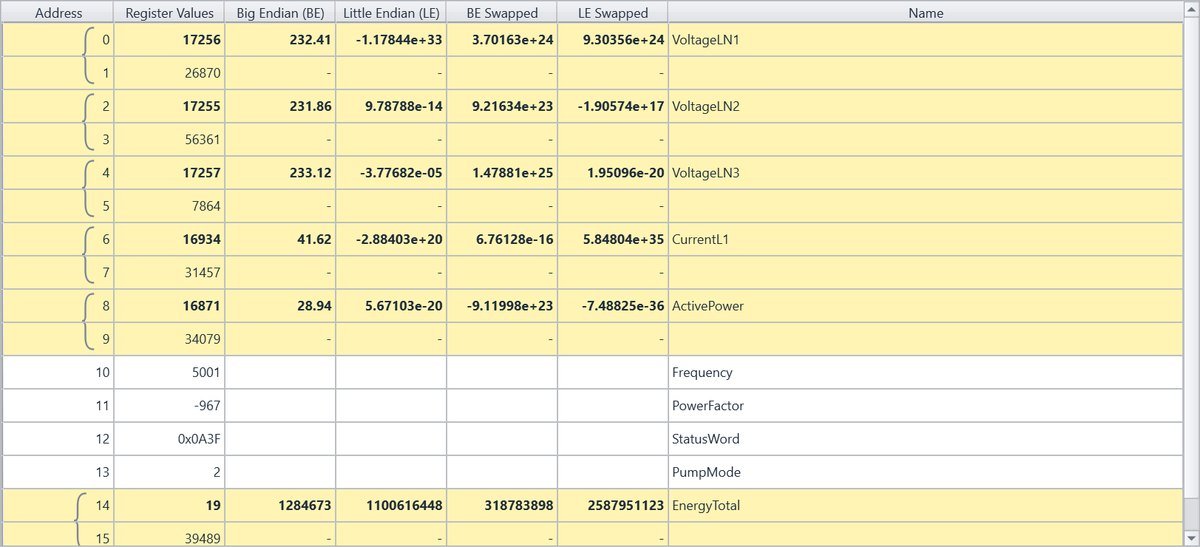
Devices disagree about how multi-register numbers are laid out. Rather than making you guess, the grid shows all four byte and word orders side by side as columns, so you read the one that matches your device and leave the device alone.
- 16-bit, one register: Short (signed), Ushort (unsigned), Hex, Binary.
- 32-bit, two registers: Int, Uint, Float (IEEE-754).
- 64-bit, four registers: Long, Ulong, Double (IEEE-754).
- Columns for Big Endian, Little Endian, BE Swapped and LE Swapped.
- Right-click a row to choose its type. Wider types cover more rows, and the grid brackets the span.
- Name each register. The name is reused as the Excel column header and the MQTT topic.
- Show protocol addresses (0-based) or PLC addresses (1-based, such as 40001).
Modbus slave simulator
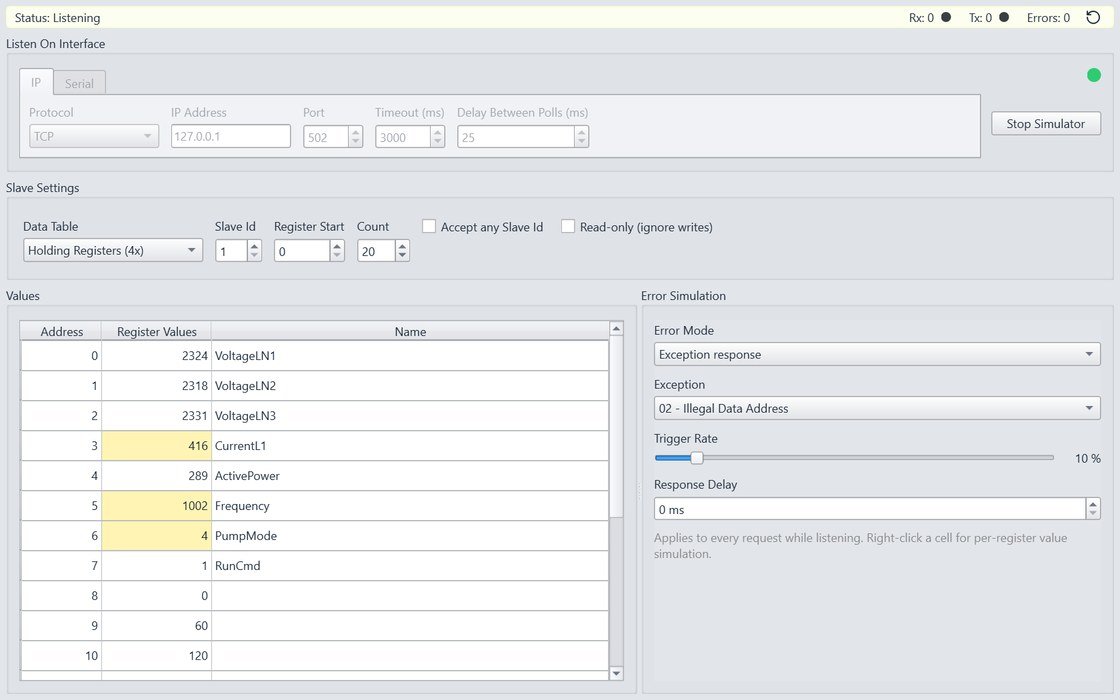
As a Modbus simulator the application listens as a Modbus server on TCP, UDP or a serial port and serves an in-memory register store. Point your SCADA, HMI or PLC at it and start integrating before the real device exists.
- Four data tables: Coils (0x), Discrete Inputs (1x), Holding Registers (4x) and Input Registers (3x), each keeping its own values.
- Type values straight into the grid, and watch a master's writes appear live.
- Per-register simulation: fixed, toggle each tick, random, increment, decrement or random in range.
- Error simulation: an exception response or no response at all, with a chosen exception code, a trigger rate and a response delay that imitates a slow device.
- Read-only mode ignores incoming writes, and Accept any Slave Id answers every unit address.
Modbus HMI screen builder
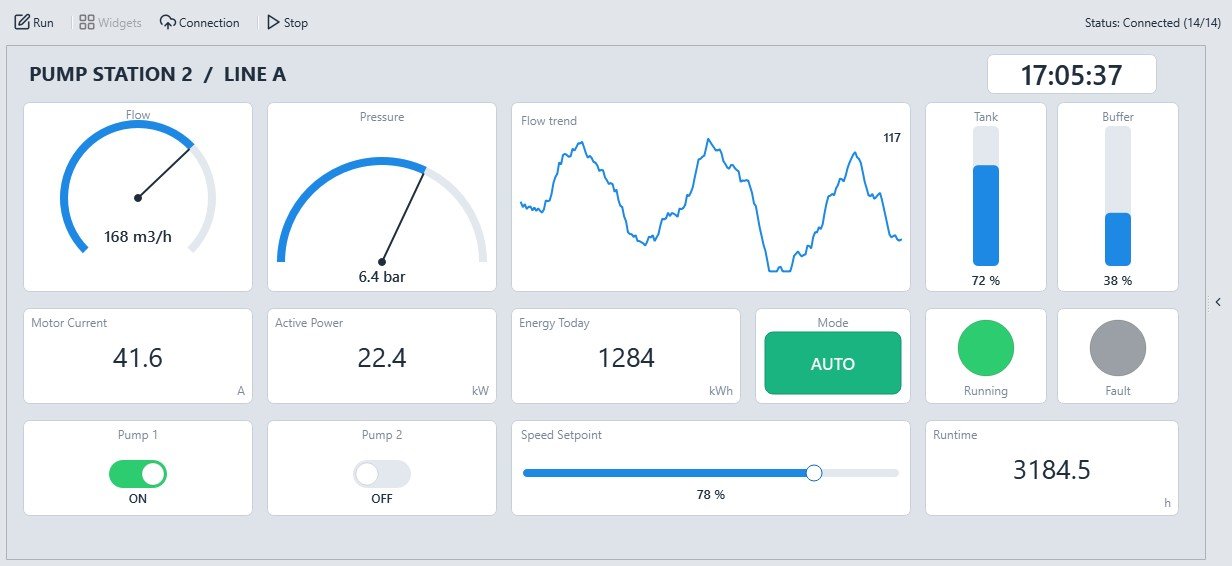
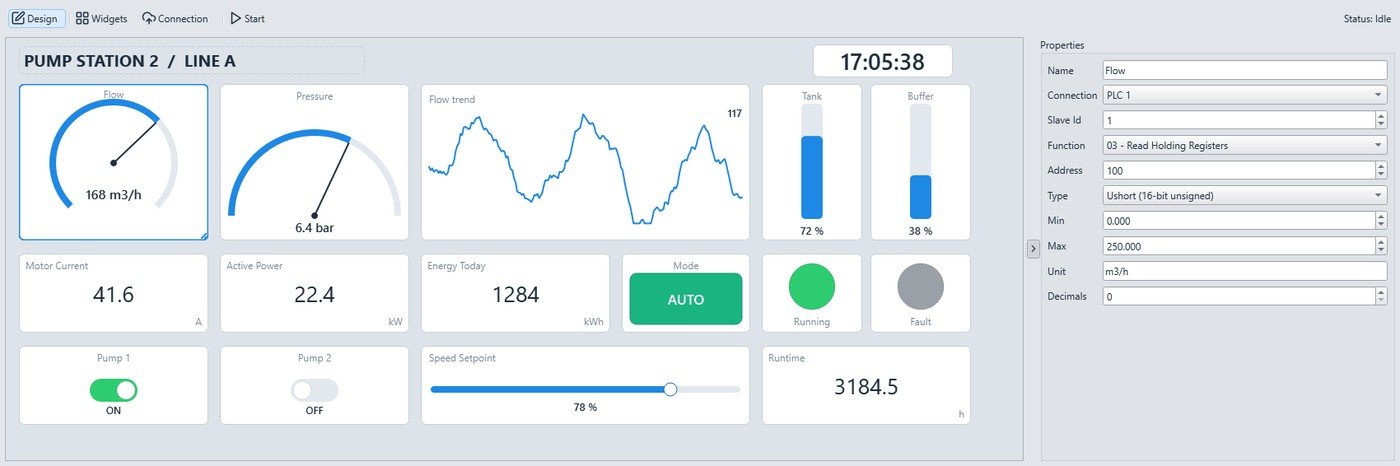
An HMI screen is a live operator panel. Design mode places and configures widgets on a canvas. Run mode locks the layout, connects, and drives every widget from live values. No coding required.
- Displays: numeric, gauge, dial 180, bar, slider, trend.
- Controls: LED, switch, multi-state.
- Shapes: rectangle, line, arrow, triangle, polygon, each with a colour.
- Other: static label with font control, analog or digital clock.
- Bind a widget by setting its connection, slave id, function, address and data type, then its name, unit, decimals and min and max range.
- A switch writes when clicked and a slider writes a setpoint as you drag it, so a screen can drive the device as well as watch it.
- A multi-state widget shows a colour and label chosen by the value range, defined as rows of an "up to" value, a colour and a label.
- One screen can hold several named connections, and connections that share an IP and port reuse a single channel.
Excel logging and Modbus to MQTT gateway
The Export section at the bottom of every poller records what you read, or forwards it to a broker. That makes the poller a small Modbus gateway: it reads a legacy Modbus device and republishes the values over MQTT, while logging the same readings for a report.
- Excel: one timestamped row per poll, streamed into a live Excel window when Excel is installed, or written to an .xlsx file you choose.
- MQTT: one JSON message with all values, or one topic per register, with a base topic, QoS and retain.
- Broker manager with host, port, client id, connection type, username, keepalive and an option to skip certificate verification for a self-signed broker.
- Test Connection checks a broker before you use it, and the Export header shows a live count of rows logged and messages sent.

Live chart and Modbus monitor
Two live views tell you what is happening: one for the values, one for the bytes.
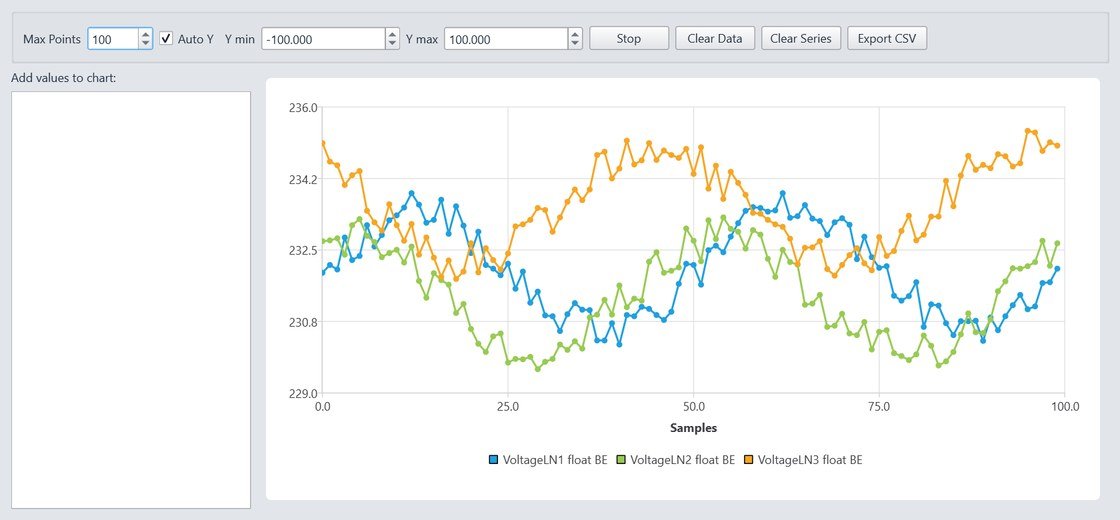
- Add any value cell to the live chart, with several series at once, each labelled by register name and type.
- Max points limits the history, Auto Y scales the axis or you set Y min and Y max yourself, and Export CSV saves the samples.
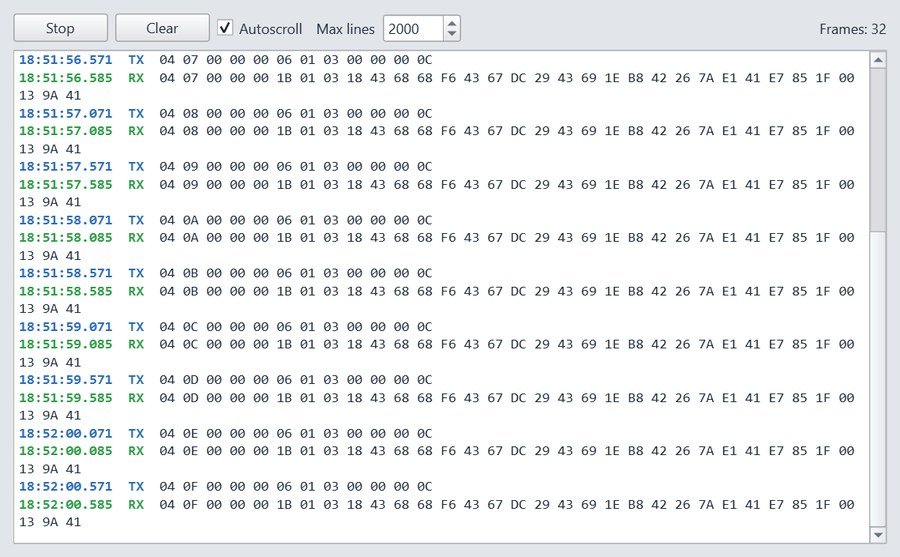
- The traffic monitor prints every request and response in hex, marked TX and RX with a timestamp, exactly as it travels on the wire, including any Modbus exception reply.
- Autoscroll, a max line cap and Clear keep the log readable.
Six transports, one connection panel
Pollers, slave simulators and HMI screens all connect through the same panel, which has an IP tab and a serial tab.
IP: Modbus TCP, UDP, RTU over TCP and ASCII over TCP
- Protocol: TCP, UDP, RTU over TCP or ASCII over TCP.
- IP address: the device address,
127.0.0.1for the local machine. - Port: the TCP or UDP port,
502by default. - Timeout: how long to wait for a reply before counting an error.
- Delay between polls: an extra pause added between poll cycles.
Serial: Modbus RTU and Modbus ASCII
- Mode: RTU or ASCII framing.
- COM port: detected ports are listed, and you can type one in.
- Baud rate, parity, data bits and stop bits, which must match the other device exactly.
- Works with USB to serial adapters and with virtual port pairs such as com0com.
A status dot shows the connection at a glance: grey for idle, yellow while connecting or waiting for a reply, green when connected, red on an error. The status line spells out the problem in words.
Details that save time
- Save your whole session. Save Configuration writes every open window to a .json project file: connections, Modbus settings, register names, display types and HMI screens. Load Configuration puts them all back.
- Reopen where you left off. The last connection is remembered between runs, and on exit you can choose to reopen the same windows next time. HMI screens can start running on launch.
- Multi-window layout. Pollers, simulators, charts and HMI screens live in one workspace, arranged from the Window menu.
- Six languages. English, Deutsch, Francais, Espanol, Turkce and Polski, remembered between sessions. Modbus function and table names stay in their standard English form.
- Light and dark. The interface follows the Windows theme setting.
- Small tools. A hex to decimal converter, an MQTT endpoint manager and an in-app help browser.
Supported protocols, function codes and data types
| Transports | Modbus TCP/IP, Modbus UDP/IP, Modbus RTU over TCP/IP, Modbus ASCII over TCP/IP, Modbus RTU (serial), Modbus ASCII (serial) |
| Read function codes | 01 Read Coils, 02 Read Discrete Inputs, 03 Read Holding Registers, 04 Read Input Registers |
| Write function codes | 05 Write Single Coil, 06 Write Single Register, 15 Write Multiple Coils, 16 Write Multiple Registers |
| Data types | Short, Ushort, Hex, Binary (16-bit), Int, Uint, Float (32-bit), Long, Ulong, Double (64-bit) |
| Byte and word order | Big Endian, Little Endian, BE Swapped, LE Swapped, shown as four columns at once |
| Serial settings | RTU or ASCII framing, COM port, baud rate, parity, data bits, stop bits |
| Addressing | Protocol addresses (0-based) or PLC addresses (1-based, for example 40001) |
| Languages | English, Deutsch, Francais, Espanol, Turkce, Polski |
| Platform | Windows 10, Windows 11 and Windows Server 2016 or newer, 64-bit. Nothing else to install |
| Price | Free for personal and commercial use |
Release notes
3.3.0 latest
- Fixed: the slave simulator now works in RTU over TCP and ASCII over TCP modes. Before, it only accepted standard Modbus TCP frames, so a master polling in RTU over TCP got no response.
3.2.0
- HMI screens now support multiple Modbus connections. Define several named connections in one screen and assign each widget to the connection it should read from.
- Connections that share the same destination (identical IP and port) automatically reuse a single channel, avoiding redundant sessions.
- Each connection has an enable and disable toggle, so polling connects only to the connections you have enabled.
- Refined menu, toolbar and connection panel styling with automatic light and dark theme support.
3.1.0
- HMI screen builder added, with gauges, dials, bars, sliders, switches, LEDs, trends, multi-state indicators, shapes and clocks bound to Modbus registers.
3.0.0
- Modbus slave simulator added, serving coils, discrete inputs, holding registers and input registers.
- Live MQTT push added, as a single JSON payload or one topic per register.
2.3.5
- The issue with RTU communication has been resolved.
Download version 3.3.0 Read the documentation
Free for personal and commercial use. No sign-up, no licence key, no tag limits.