 Modbus Tester
Home / Documentation
Modbus Tester documentation
The same guide that ships inside the application under the Help menu, from a first connection to serial wiring, HMI binding and MQTT publishing.
Quick start
Modbus Tester lets you act as a Modbus master (poll a device) or a Modbus slave (simulate a device). Each window is independent, so you can open several at once and arrange them from the Window menu.
Poll a device (master)
- Open File, New Poller.
- In Connection Settings, choose the IP or Serial tab and enter the device address.
- Set Function, Slave Id, Register Start and Count.
- Click Connect. Live values appear in the grid and the Tx and Rx lights blink.
Simulate a device (slave)
- Open File, New Slave Simulator.
- Pick the interface to listen on, set the Slave Id, and click Start Listening.
- Edit register values in the grid. A master elsewhere can read and write them.
Tips
- Double-click a value cell in a poller to write that single register or coil.
- Use Export to log live values to Excel or publish them over MQTT.
- Traffic shows the raw request and response frames.
- Tools, Convert Hex to Dec is a quick hex converter.
- The Language menu switches language, and your choice is remembered.
Connections
Pollers, slave simulators and HMI screens all connect the same way, through Connection Settings, which has two tabs: IP and Serial.
IP (network)
- Protocol: TCP, UDP, RTU over TCP, or ASCII over TCP.
- IP Address: the device address,
127.0.0.1for the local machine. - Port: the TCP or UDP port, Modbus default
502. - Timeout (ms): how long to wait for a reply before counting an error.
- Delay Between Polls (ms): an extra pause added between poll cycles.
For app to app testing on one PC, IP with 127.0.0.1 is the easiest choice.
Serial (RTU and ASCII)
- Mode: RTU or ASCII framing.
- COM Port: the serial port to use. Detected ports are listed, and you can also type one in.
- Baud Rate, Parity, Data Bits, Stop Bits: these must match the other device exactly, or the two sides will not understand each other.
The status light
A small dot shows the connection state: grey (idle), yellow (connecting or waiting for a reply), green (connected), red (error). The status line and the error text next to it explain any problem.
Serial vs TCP/IP
Modbus can run over a network (TCP/IP) or over a serial line (RTU/ASCII). Which one you pick changes what you need in order to connect.
TCP/IP, easiest for software testing
If both the master and the slave are software on the same PC, use TCP/IP with host 127.0.0.1
and port 502. No cable and no COM port are needed. This is the normal way to test two Modbus
programs together.
Serial (RTU/ASCII)
A serial simulator simulates the device, not the wire. The COM port is the wire, so a serial slave still needs a real port to listen on.
Key rule: one COM port belongs to one program. A master and a slave always need two separate ports wired together (a null modem link). You can never point two programs at the same COM port.
Master is a physical device (PLC, panel)
Connect it to your PC with a serial cable into a real COM port, often a USB to serial adapter. The slave listens on that port.
Master is software on the same PC
No hardware is needed, but you still need two ports. Create a virtual pair with a tool such as com0com (free), for example COM10 and COM11:
- The slave simulator listens on COM10.
- The master connects to COM11.
- The tool bridges the pair in software.
Polling a device as a master
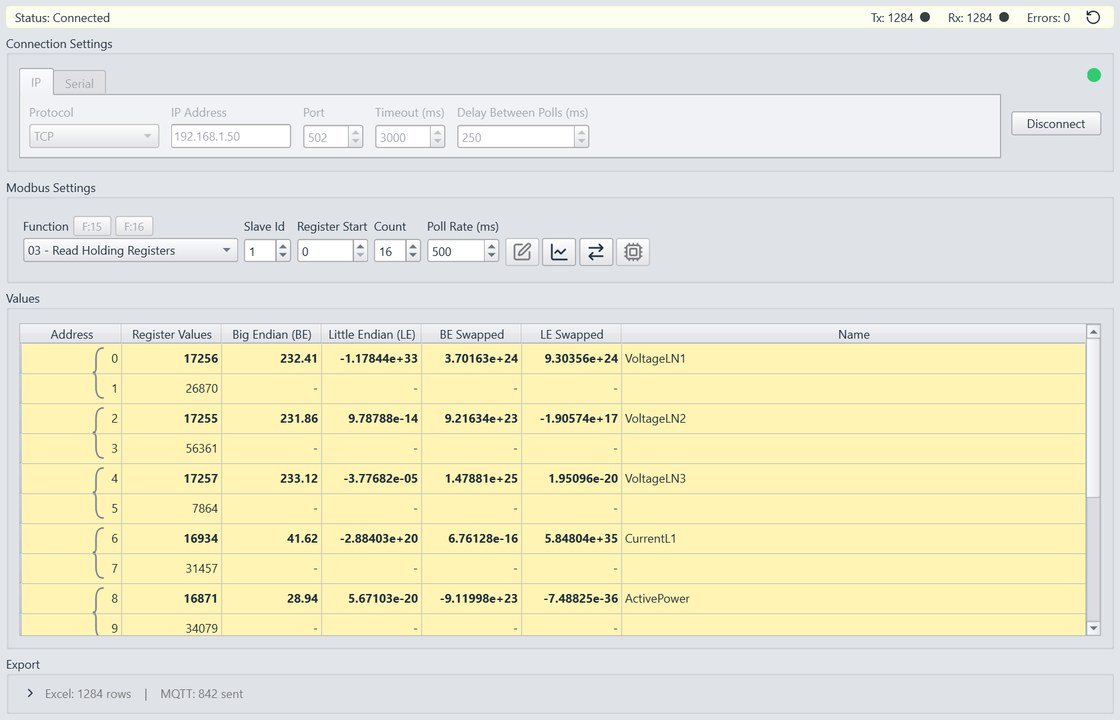
A poller acts as a Modbus master: it repeatedly reads, and can write, a device. Open one with File, New Poller.
Modbus settings
- Function: what to read or write. 01 to 04 are reads (Coils, Discrete Inputs, Holding Registers, Input Registers); 05, 06, 15 and 16 are writes.
- Slave Id: the unit address of the target device.
- Register Start and Count: the first address and how many items to read.
- Poll Rate (ms): how often to repeat the request.
These can be changed while connected. The poll loop picks them up live.
Reading
Click Connect. Each cycle the grid refreshes with the latest values. On the status bar, Tx counts requests sent, Rx counts good replies and Errors counts failures. The Tx light blinks on every request, and the Rx light blinks green on a good reply and red on a timeout or error.
Writing values
- Double-click a value cell to write that single register or coil.
- Select a write function (05, 06, 15, 16) and click Write, or use the F:15 and F:16 quick buttons, to open the write dialog.
Device info
The Device Info button reads the device identification (Modbus function 43 / 17): vendor, product code, version and so on.
Simulating a device as a slave
A slave simulator acts as a Modbus server: it listens and serves an in-memory register store that a master elsewhere can read and write. Open one with File, New Slave Simulator.
Start listening
- In Listen On Interface, pick the IP or serial interface to listen on.
- Set the Slave Id the master will address.
- Click Start Listening. The status light turns green while serving.
Data tables
Data Table selects which block you view and edit: Coils (0x), Discrete Inputs (1x), Holding Registers (4x) or Input Registers (3x). Each table keeps its own values, so switching tables never loses the others.
Editing values
Type directly into the Values grid. Writes that arrive from a master also appear here, so you can watch a master change your registers live.
Per-register value simulation
Right-click a cell to make that value change on its own over time: Fixed (no simulation), Toggle each tick, Random, Increment (+1), Decrement (-1) or Random in Range. This is handy for feeding a master changing data without a real sensor.
Error simulation
The Error Simulation panel makes the slave reply with faults, to test how a master handles them:
- Error Mode: None, exception response, or no response (timeout).
- Error Code: which Modbus exception to return in exception mode.
- Trigger Rate: how often the fault fires (100% is every request).
- Response Delay: delays every reply, to imitate a slow device.
HMI screens
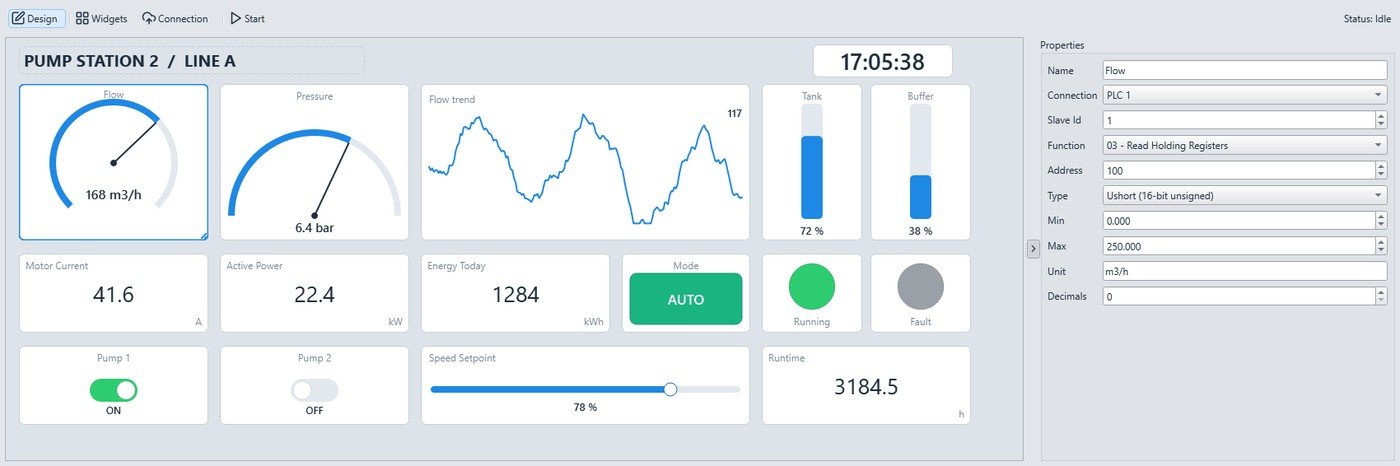
An HMI screen is a live operator panel: drop widgets onto a canvas, bind each one to a Modbus register, and run them live. Open one with File, New HMI Screen.
Design mode and run mode
- Design: add, move and configure widgets. A grid helps you align them.
- Run: the layout locks, the screen connects, and widgets update live.
Adding widgets
Click Widgets to open the palette. Widgets are grouped into Displays, Controls, Shapes and Other. Click one to drop it on the canvas, then drag it into place. Right-click a widget for Duplicate or Delete.
Binding a widget to a register
Select a widget and use the Properties panel on the right:
- Slave Id, Function, Address, Type: which register feeds the widget.
- Min and Max: the range for gauges, bars, sliders and trends.
- Name, Unit, Decimals: how the value is labelled and shown.
Only the fields that apply to the selected widget are shown.
Widgets
- Displays: Numeric, Gauge, Dial 180, Bar, Slider, Trend.
- Controls: LED, Switch, Multi-State.
- Shapes: Rectangle, Line, Arrow, Triangle, Polygon, each with a colour.
- Other: Label (static text), Clock (analog or digital).
Interactive controls (writing)
- Switch writes when clicked. Bind it to Read Coils (writes with Write Single Coil) or Read Holding Registers (Write Single Register). Discrete Inputs and Input Registers are read-only, so a switch cannot write to them.
- Slider writes a setpoint between Min and Max as you drag it.
Multi-state
A multi-state widget shows a colour and label chosen by the value's range. Click Edit States to define rows of an "up to" value, a colour and a label.
Connection
Click Connection to set the interface (TCP or serial) the screen uses. Its Delay Between Polls (ms) sets how often the widgets refresh. Click Start to run. The status shows Connected (N/N) with how many widgets are reading. If it shows 0 of N, check the slave id, function and address of your widgets.
From version 3.2.0 a screen can hold several named connections. Assign each widget to the connection it should read from, and toggle a connection off to leave it out of the run.
Saving
Screens are saved with the app configuration and with the session, so they reopen next time. With session auto-start enabled they can begin running as soon as the application launches.
The value grid and data types
Both the poller and the slave simulator show values in the same grid. You control how each value is interpreted.
Display types
Right-click a register row and pick a type:
- 16-bit (1 register): Short (signed), Ushort (unsigned), Hex, Binary.
- 32-bit (2 registers): Int, Uint, Float (IEEE-754).
- 64-bit (4 registers): Long, Ulong, Double (IEEE-754).
A 32-bit value occupies two registers and a 64-bit value four, so wider types cover more rows.
Endianness (byte and word order)
Multi-register numbers can be laid out four ways, shown as columns: Big Endian (BE), Little Endian (LE), BE Swapped and LE Swapped. Devices differ, so if a float or 32-bit value looks wrong, read it from the column that matches your device instead of changing the data.
Naming a register
Type a label in the Name column so a register is easy to recognize. It is also used as the column header when logging and publishing.
Addressing: PLC vs protocol
Display, PLC Addresses (Base 1) switches how addresses are shown. Off: protocol addresses, 0-based, exactly as sent on the wire. On: PLC addresses, 1-based, as printed in many device manuals, for example 40001 for the first holding register. This only changes the display, not what is sent.
Logging to Excel and publishing to MQTT
Open the Export section at the bottom of a poller to record or forward the values you are reading.
Excel live logging
Tick Excel Live Log to append every poll as a new row. If Excel is installed, values
stream into a live Excel window you can watch, otherwise the application writes an .xlsx file
that you choose. The row count and any error, for example if you close the Excel window, are shown next to
the checkbox.
Publish to MQTT
Tick Publish to MQTT to send values to an MQTT broker:
- Endpoint: which broker to use. Manage brokers with Manage, or under Tools, Gateway Endpoints (MQTT).
- Format: one JSON message with all values, or one topic per register.
- Topic: the base topic to publish under.
- QoS and Retain: standard MQTT delivery options.
The Export header shows a live summary of rows logged and messages sent.
Managing brokers
Under Tools, Gateway Endpoints (MQTT) you add, edit and test brokers: broker host, port, client id, connection type, username, keepalive, and an option to skip certificate verification for a self-signed broker. Test Connection checks it before you use it.
Charts and traffic
Live chart
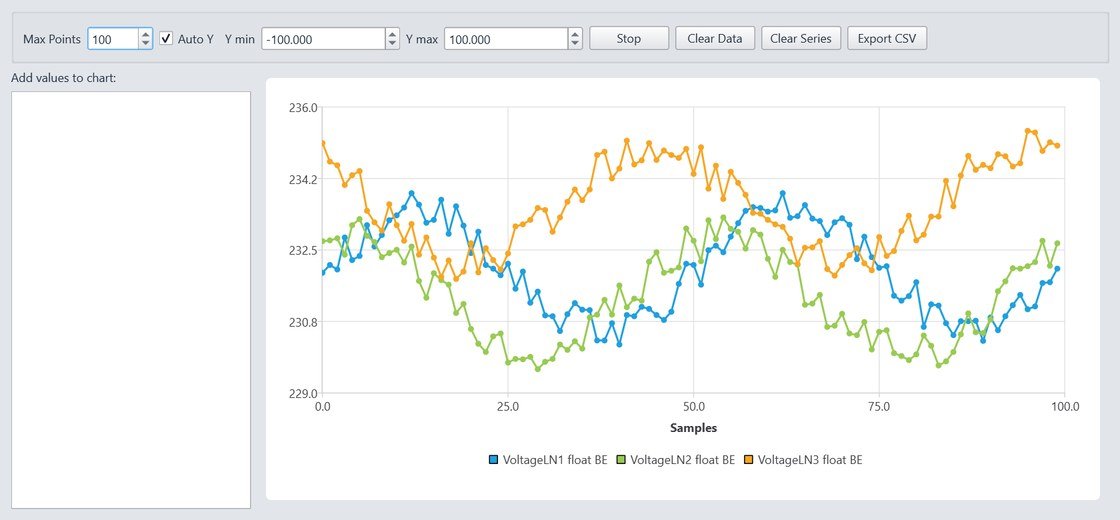
- Click Live Chart to open the chart, then add values with Add To Live Chart, also on a value cell's right-click menu.
- Max Points limits how much history is kept.
- Auto Y scales the vertical axis automatically, or set Y min and Y max yourself.
- Clear empties the chart, Export CSV saves the samples to a file.
Traffic monitor
Click Traffic to open the communication window. It shows the raw request and response frames (TX and RX) in hex, exactly as they travel on the wire. This is the best tool for debugging: you can see the actual bytes, the function code and any exception reply. Autoscroll keeps the newest frame in view, Max lines caps how many lines are kept, and Clear empties the log.
Saving your setup
File, Save Configuration writes every open window to a .json file, and
File, Load Configuration restores it. That includes connections, Modbus settings,
per-register display types and names, and HMI screens. When you exit you can also choose to reopen the
same windows next time, and the last connection is remembered automatically between runs.
Frequently asked questions
Is Modbus Tester really free?
Yes. It is free for personal and commercial use, with no licence key, no tag limit and no trial period. There is no paid edition of the tool.
Which Modbus protocols does it support?
Modbus TCP/IP, Modbus UDP/IP, Modbus RTU over TCP/IP, Modbus ASCII over TCP/IP, Modbus RTU over a serial port and Modbus ASCII over a serial port. Every transport works both as a master and as a slave simulator.
Which Modbus function codes can it read and write?
Reads: 01 Read Coils, 02 Read Discrete Inputs, 03 Read Holding Registers and 04 Read Input Registers. Writes: 05 Write Single Coil, 06 Write Single Register, 15 Write Multiple Coils and 16 Write Multiple Registers. It also reads device identification with function 43 / 17.
Can I run a Modbus master and a slave simulator on the same PC?
Yes, over TCP. Start the slave simulator listening on 127.0.0.1 port 502 and
point a poller window at the same address. Over serial you need two COM ports bridged together, for
example a virtual pair created with com0com, because one COM port can only belong to one program. See
serial versus TCP/IP.
Can I use it as a Modbus TCP tester and a Modbus RTU tester?
Both, in the same window set. The connection panel has an IP tab for Modbus TCP, UDP, RTU over TCP and ASCII over TCP, and a serial tab for Modbus RTU and Modbus ASCII on a COM port. A poller, a slave simulator and an HMI screen each pick their own transport, so you can test a network device and a serial device side by side.
Is a Modbus master the same as a Modbus client?
Yes. The current Modbus specification says client and server, while most devices, manuals and engineers still say master and slave. A poller window is the client or master, the simulator is the server or slave. This documentation uses the older names because that is how most equipment is labelled.
My float value looks wrong. What should I change?
Nothing on the device. Devices differ in byte and word order, so the grid shows all four layouts side by side as columns: Big Endian, Little Endian, BE Swapped and LE Swapped. Read the value from the column that matches your device.
Does it work with 40001 style PLC addresses?
Yes. Display, PLC Addresses (Base 1) switches the grid between 0-based protocol addresses, exactly as sent on the wire, and 1-based PLC addresses as printed in most device manuals. It changes the display only, not the request.
Can Modbus Tester publish register values to MQTT?
Yes. A poller can publish every reading to any MQTT broker, either as one JSON message with all values or as one topic per register, with a base topic, QoS and retain options. It can log the same readings to an Excel .xlsx file at the same time.
Does it run on Linux or macOS?
The published installer is for Windows 10, Windows 11 and Windows Server 2016 or newer, 64-bit. The application is written in Python and Qt and runs from source on Linux and macOS, but no signed build is distributed for those systems.
Troubleshooting
A float or 32-bit value looks wrong
The device uses a different byte or word order. Do not change the data: read the value from the column that matches your device (BE, LE, BE Swapped or LE Swapped), and set the row type to Float, Int or Uint as appropriate.
"Port not available" on a serial connection
The COM port does not exist, or another program already owns it. One COM port belongs to one program at a time. To run a master and a slave on the same PC, create a virtual port pair with a tool such as com0com and give each program its own end.
Errors count up and the Rx light blinks red
The request is going out but no valid reply is coming back. Check the slave id, the IP address and port, and that the register range exists on the device. Open Traffic to see whether the device answers at all, or answers with a Modbus exception such as 02 Illegal Data Address.
The addresses do not match the device manual
Many manuals print 1-based PLC addresses (40001 for the first holding register) while the protocol itself is 0-based. Switch Display, PLC Addresses (Base 1) on or off until the two agree.
An HMI screen shows 0 of N reading
The screen is connected but no widget is getting a value. Check each widget's slave id, function and address, and that the widget is assigned to an enabled connection.
Serial master and slave on one PC
You need two ports bridged together. Install com0com (free), create the pair COM10 and COM11, let the
simulator listen on COM10 and connect the master to COM11. Alternatively skip serial altogether and use
TCP on 127.0.0.1:502.
Still stuck? Get in touch and tell us what you are connecting to and what you see. The same guide is available inside the application under the Help menu, in all six languages.